

How Do You Read Crypto Charts? A Comprehensive Guide
Cryptocurrency trading can be a lucrative endeavor, but it’s not for the faint of heart. To navigate the volatile waters of the crypto market, one must learn how to read crypto charts. In this guide, we will take you through the process step by step, providing insights based on real-world experience and authoritative sources.
Before diving into the intricacies of reading crypto charts, let’s understand the basics.
Table of Contents
The Fundamentals
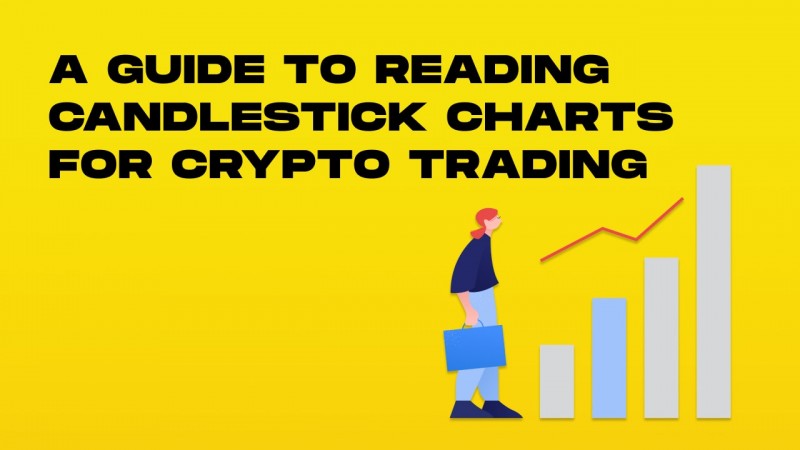
Candlestick Charts
Candlestick charts are essential for crypto analysis because they provide a visual representation of price movements over time. Each candlestick represents a specific time frame (e.g., 1 hour, 1 day), and it consists of a body and wicks. The body represents the opening and closing prices during that time frame, while the wicks show the highest and lowest prices reached.
Patterns formed by these candlesticks, such as doji, hammers, or shooting stars, can reveal market sentiment. For example, a long bullish candle suggests strong buying pressure, while a long bearish candle indicates significant selling pressure.
Line Charts
Line charts offer a simplified view of a cryptocurrency’s performance by plotting only the closing prices over time. They are useful for getting a high-level overview of price trends and are often used for long-term analysis. However, they may not provide as much detail as candlestick charts.
Analyzing Trends
Support and Resistance Levels
Identifying support and resistance levels is crucial for technical analysis. Support levels are price points where buying interest is strong enough to prevent further price drops, while resistance levels are where selling pressure prevents prices from rising further. Recognizing these levels can help you make informed decisions about entry and exit points for your trades.
Moving Averages
Moving averages are used to smooth out price data and identify trends. Simple Moving Averages (SMAs) calculate the average price over a specific number of periods, while Exponential Moving Averages (EMAs) give more weight to recent prices. A crossover of short-term and long-term moving averages can signal a change in trend direction, helping you decide whether to buy or sell.
Relative Strength Index (RSI)
The RSI is a momentum oscillator that helps traders assess whether an asset is overbought or oversold. RSI values range from 0 to 100, with readings above 70 indicating overbought conditions and readings below 30 suggesting oversold conditions. Traders often use RSI to time their entries or exits, aiming to buy when the RSI is low and sell when it’s high.
Chart Patterns
Head and Shoulders
Recognizing chart patterns is essential for predicting price movements. The “Head and Shoulders” pattern, for example, consists of three peaks: a higher peak (head) between two lower peaks (shoulders). This pattern typically signals a trend reversal from bullish to bearish or vice versa.
Double Tops and Bottoms
“Double Tops” and “Double Bottoms” are also reversal patterns, with double tops indicating a potential bearish reversal and double bottoms suggesting a bullish reversal. Identifying these patterns early can help you make profitable trades.
Reading Depth Charts
Depth charts display the supply and demand for a cryptocurrency at various price levels. The visual representation of buy and sell orders can provide insights into market sentiment. For example, if there are more buy orders (demand) at a particular price level than sell orders (supply), it may indicate potential upward price movement, and vice versa.
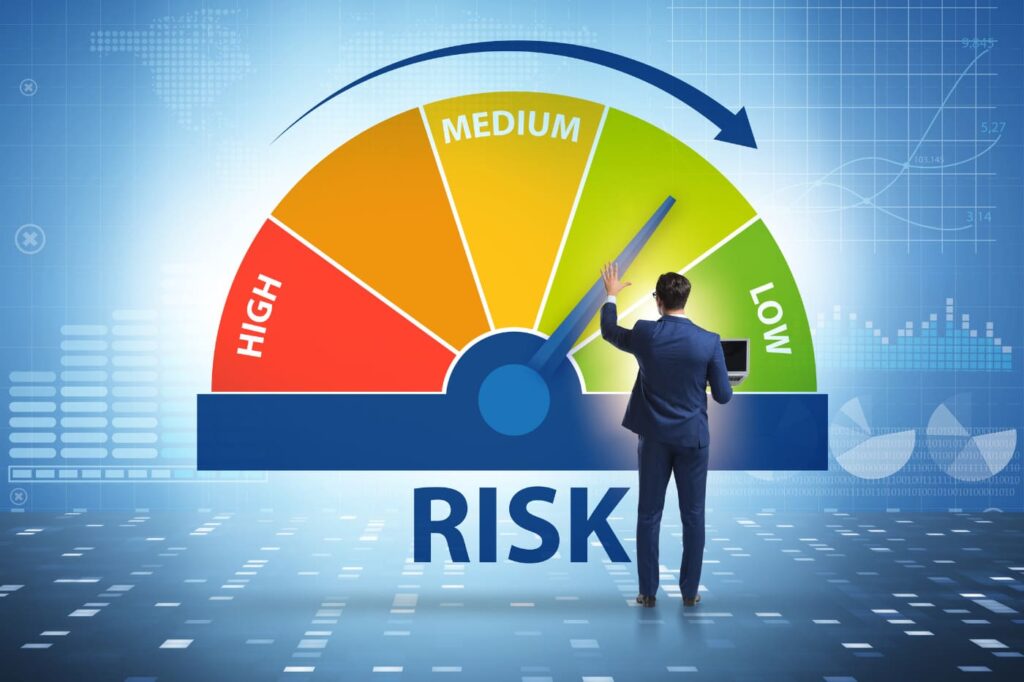
Risk Management
Setting stop-loss orders is a crucial part of risk management. These orders automatically sell your assets if prices drop to a certain level, limiting potential losses. Calculating the risk-reward ratio before entering a trade helps you assess whether the trade is worth pursuing. A good rule of thumb is to aim for a risk-reward ratio of at least 1:2, meaning the potential reward should be at least twice the potential risk.
Frequently Asked Questions
How often should I check crypto charts?
You should monitor charts regularly, but avoid becoming obsessed. Daily checks are often sufficient, but adjust your frequency according to your trading strategy.
What’s the best chart analysis tool?
There are many chart analysis tools available, including TradingView and CoinGecko. Choose one that suits your needs and preferences.
Is crypto chart analysis foolproof?
No, it’s not. Crypto markets can be highly unpredictable. Chart analysis is a valuable tool, but it should be used in conjunction with other forms of research and analysis.
Can I trade without analyzing charts?
While it’s possible, it’s not recommended. Chart analysis provides valuable insights that can significantly improve your trading decisions.
Should I only rely on chart patterns?
No, it’s essential to consider other factors such as news, market sentiment, and fundamental analysis alongside chart patterns.
How do I stay updated on crypto news?
Follow reputable cryptocurrency news websites, join forums, and engage with the crypto community on social media platforms.
Conclusion
In the world of cryptocurrency, knowledge is power. Learning how to read crypto charts is a vital skill that can help you navigate the complex and ever-changing market. By understanding the fundamentals, analyzing trends, and staying informed, you can make more informed decisions and increase your chances of success in the crypto trading arena.